Income Tax Rates by Country & Global Salaries After Taxes

There are precious few certainties in life but as the old saying goes, taxes are one of them. With America’s tax season in full swing, that inevitability is sure to be on the minds of many in the United States.
During this time of the year, it is easy to forget that America isn’t the only country where tax considerations loom over the population. There are many differences in financial realities around the world and varying income tax rates by country.
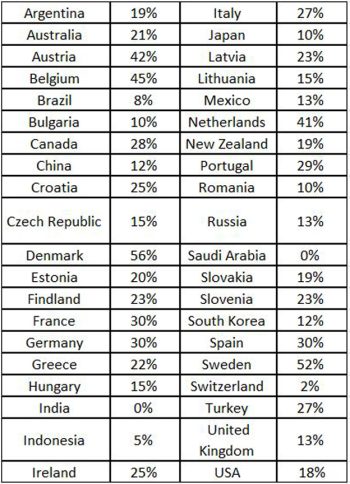
With that in mind, CapRelo decided to take a look at salaries, taxes and take-home pay from a number of countries all over the world, and to contextualize that information for an American audience. Here’s a quick overview of tax rates by country on average wages across the globe:
Tax Rates By Country – Overview
Beyond the tax rates per country, here’s an in-depth look at everything we uncovered related to average wages and the taxes’ impact on workers’ income around the world.
To get a baseline on how the average citizen in each country can expect to be taxed, it’s necessary to know how much the average citizen makes. CapRelo examined a report from an intergovernmental economic organization listing the average annual salary for the countries we analyzed. After converting local currencies to their equivalent in U.S. dollars, it was possible to assemble the map above, which illustrates how much the average worker can expect to make around the globe. The countries in darker red are nations where workers are compensated the most.
Of course, the taxman will take a cut, and we were able to find the overall percentage of salary that someone making an average wage can expect to pay in taxes in each country. This was done by taking post-tax earnings and dividing them by pre-tax earnings. We felt this was the best way to produce a consistent comparison across countries, given the occasionally complex nature of various tax codes.
Once taxes have been paid, we get a better picture of exactly how much money the average annual wage is for workers around the globe. This chart shows post-tax take-home pay, once again converted to U.S. dollars. Countries in dark red here have the highest take home pay.
Comparing maps can make it challenging to ascertain the exact scope of tax impact, so we decided to visualize the data an additional way to show how much of the average wage in each country is consumed by taxes.
Many in America comment on how much they have to pay in taxes, so we thought it would be fun to look at how that rate would change in other countries. By taking the average annual American wage and factoring in the rate it would be taxed in other nations, it is possible to see where things could be better or worse. Only ten of the surveyed countries would produce a lower tax bill than Americans already experience, with the rest taking more… at times, significantly so. Bet you never thought you’d be happy with your current taxes!
Finally, CapRelo wanted to provide an even more detailed examination of taxes around the globe. The result features much of the same data that has already been presented, like average annual salary and post-tax take-home pay for every country (and the average American wage), as well as some new information. First is a more detailed breakdown of the specific tax rate as it applies to the average wage in each country, and second is an analysis of purchasing power.
The latter feature utilizes the Big Mac Index, a metric devised by The Economist that takes the price of a McDonald’s Big Mac in two countries to determine the relative value of money in each place. Utilizing this tool, we were able to find out how much the post-tax take home pay was actually “worth.” As a result, we see that while somewhere like Russia has an average post-tax take home pay amount equivalent to just $8,456, that money allows someone to buy the same amount of “stuff” as someone with $19,488 in America. On the flip side, Switzerland’s average take home pay of $84,006 only goes as far as $65,567 would in the United States.
While taxes may be constant, the information above demonstrates how actual cost impact is not. Hopefully seeing how taxes by country compare across the globe—takes a little bit of the sting out of filing this year!
From tax rates to moving expenses, our team can provide expert insights into international employment. Learn more about our global relocation services today!


